Introducing Leadwerks IDE
I don't write a lot of blogs anymore because most of our communication takes place through our weekly live chats on Discord. However, when there is a topic that I want to explain in detail, blogs are a great format for this.
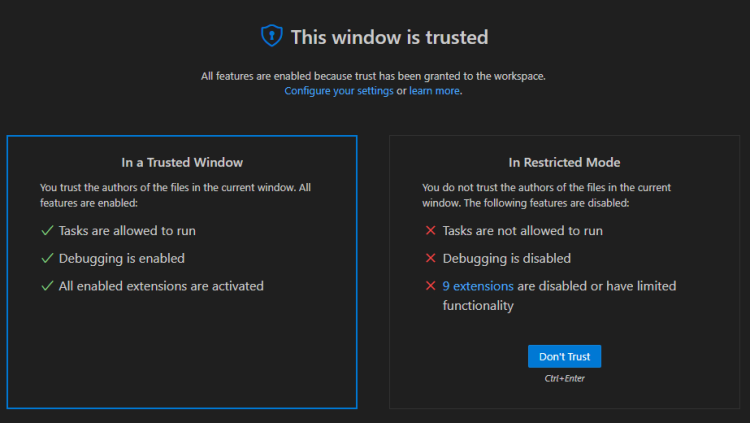
The original idea in Leadwerks 5 was to integrate Microsoft's Visual Studio Code as the IDE for the engine, rather than using the somewhat clunky built-in IDE we had in Leadwerks 4.
Visual Studio Code was the hot new text editor at the time, with cross-platform support and a dark theme that blended well with our new editor. A robust extensions system provided support for integrations with many languages including GLSL and Lua. There was even a Lua debugger with advanced features that seemed to turn Lua into a first-class programming language.
However, outsourcing a significant part of our user experience to a third party application is not without disadvantages. One day I was looking at some old Leadwerks 4 tutorials on Lua basics, and the simplicity of the debug interface really jumped out at me. This got me thinking about the whole user experience for new Lua developers.
Installation
The setup process for Visual Studio Code with Leadwerks 5 is not as streamlined as I would like.
- Find and install Visual Studio Code (not to be confused with Microsoft Visual Studio).
- Install the DevCat Lua Debugger extension from the Visual Studio Code marketplace (not any of the other hundreds of search results that appear when you search for this, and definitely not the actboy168 Lua debugger that will make your game crash).
- Navigate four levels deep in the program settings to find and enable the "Allow Breakpoints Everywhere" option. If you don't do this, or if the setting gets disabled somehow, the debugger won't work.
The setup process is not too difficult, but I don't want a new user's first impression to be "Welcome to Leadwerks 5, the first thing you need to do is go install this other program and some weird things you've never heard of".
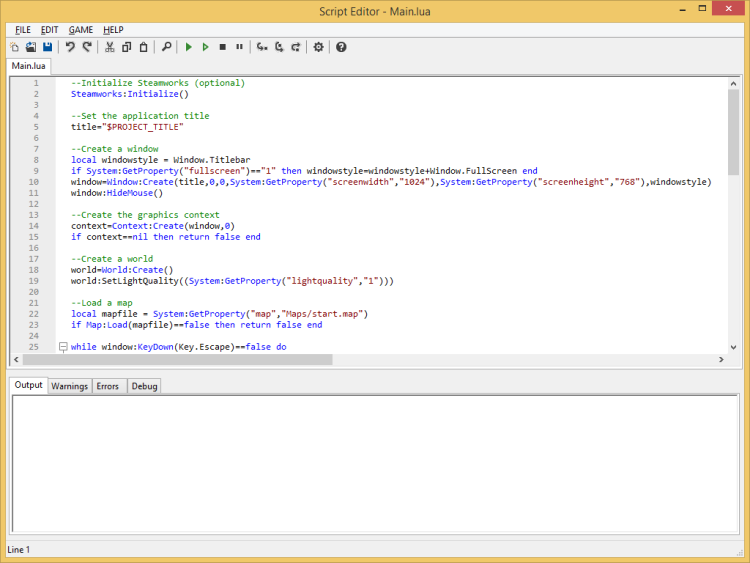
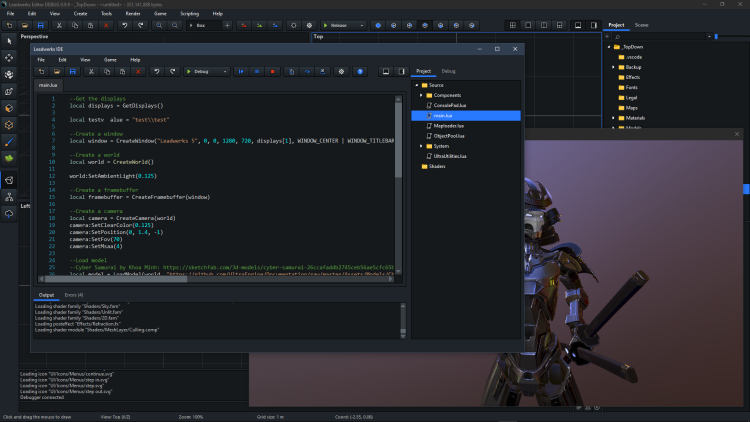
The alternative to this is to just provide a build-in IDE (Integrated Development Environment) as part of the level editor. This completely eliminates the need to install anything extra. Visual Studio Code can still be used, and you can choose how Lua files should be opened when you double-click them in the project browser. Three options are provided in the program settings:
- Open in IDE
- Open in Visual Studio Code (also opens the current folder as a project)
- System Default
It was not too difficult to get working, and after one week and 1500 lines of code I have a nearly-completed IDE working. The text editor is based on @klepto2's excellent Scintilla widget, which he has generously made available for free on Github under the MIT license.
Error Handling
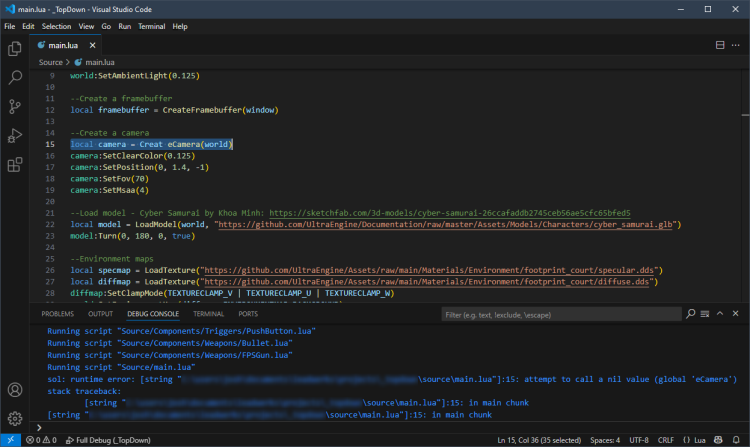
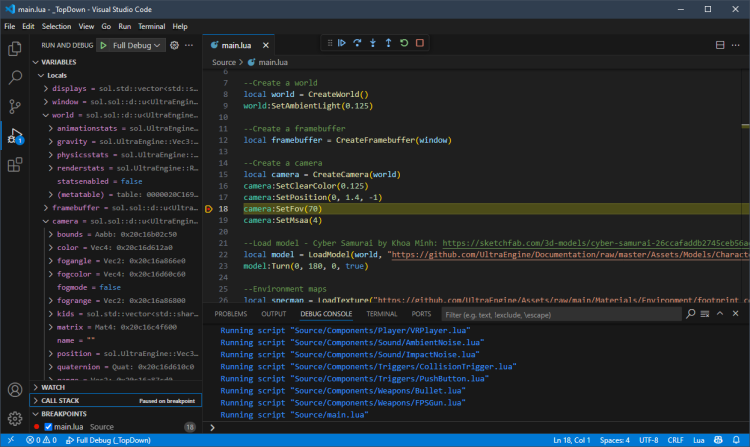
When a coding error is encountered, the Visual Studio console dispays a rather verbose message.
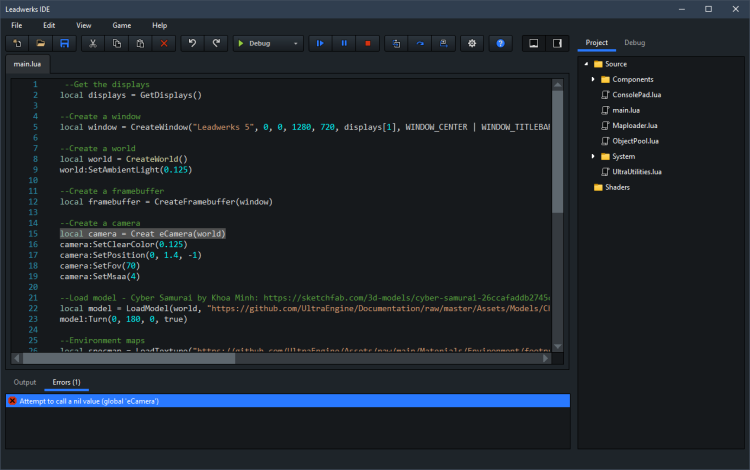
The built-in IDE displays a clearly highlighted error message that tells you what the problem is. I even coded it to convert the first letter in the error message to uppercase, just to make it look a little nicer.
Both interfaces contain the same information, but with the built-in IDE you spend a lot less time scanning to find what you're looking for...which is a really good thing for an interface that gets heavily used!
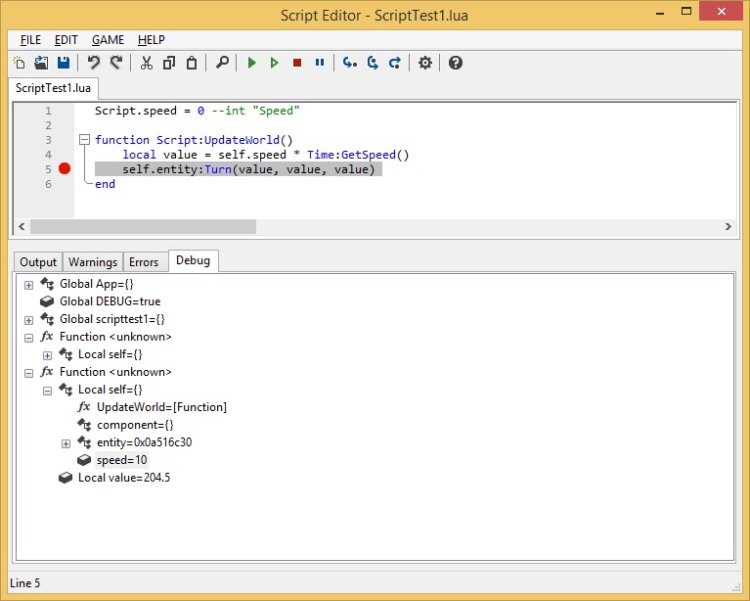
Debugging
Visual Studio Code has some advanced features like hovering over a word in the text editor to display the value. However, the whole interface is flooded with Visual clutter. Type names include their namespace and things like shared_ptr, which is an underlying detail that is irrelavant to Lua.
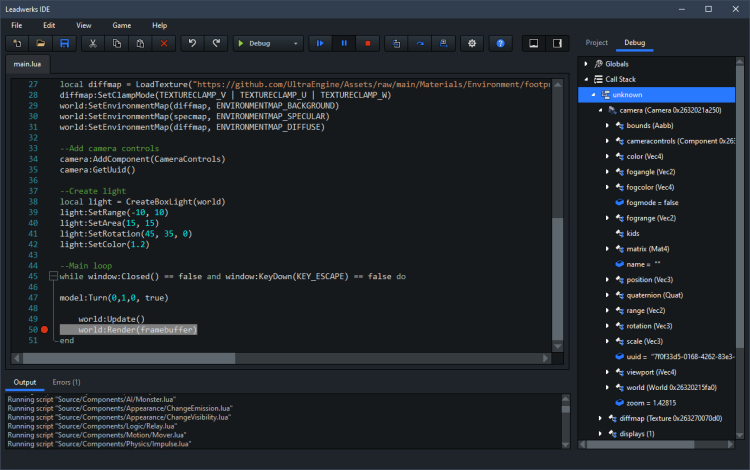
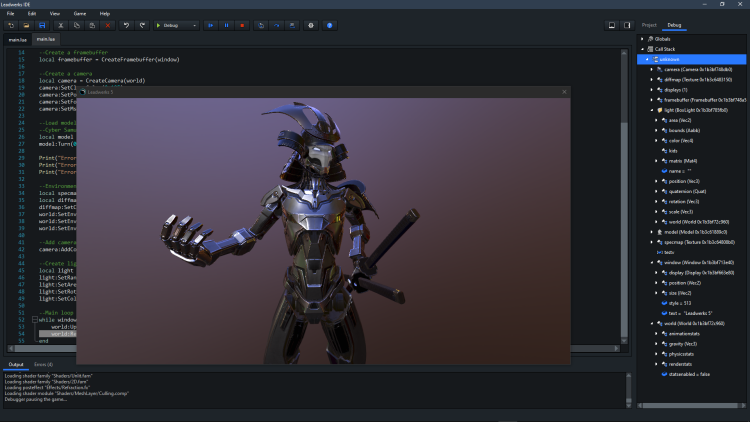
The built-in IDE provides a more clear and concise view, with simplified type names and color-coded icons. It even displays an icon for each type of entity.
Window Management
Since Visual Studio Code is an external program, it does not stay on top of the editor window. To select the main editor window, VSCode, or game window, you need to click on their icons in the Windows taskbar or use Alt+Tab to cycle through windows.
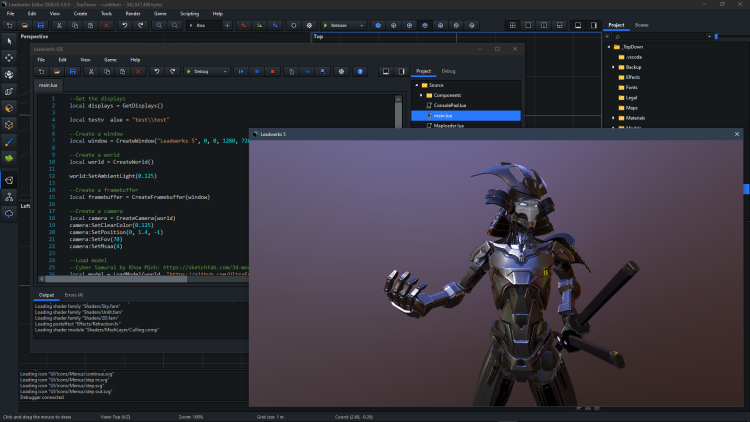
When the built-in IDE is used, by default, the game window appears on top of the editor when the game runs.
With some clever Win32 programming, we can retrieve the game window from the running game's process handle. By responding to WINDOWSELECT and WINDOWDESELECT events, we can adjust the z-order of the game and editor windows to make the game and IDE act like they are both siblings parented to the main window. Whichever window is selected will appear on top, but both windows always stay on top of the main editor window.
If the IDE window is maximized, we can detect this event and then change the game window parent to the IDE window itself. This allows you to use the debugger in fullscreen, while the game remains on top.
With this design you will spend less time hunting for icons in the Windows taskbar to switch windows back and forth, and more time working on your game.
Finally, we are starting to see bloat creep into the Visual Studio Code user experience and it's no longer the light and fast text editor it began as.


Overall, the built-in IDE provides a smoother workflow with a much more focused presentation that highlights the information you are looking for with a lot less visual clutter. While the Visual Studio Code debugger will remain for those who wish to continue using it, I can already see that the built-in IDE will provide a massive boost in productivity to all our Lua developers, and a much improved user experience for new users.
-
 3
3
-
 2
2

 SCP
SCP




4 Comments
Recommended Comments